ProPEAT gave similar health and aesthetics without excessive mowing.
A fertilizer trial was conducted with ProPEAT Fertilizer. ProPEAT is a fertilizer blended with various humic acid and possibly other additives thought to improve nutrient use efficiency and have growth stimulation effects. Four treatments (control, urea + traditional, PCU + traditional, and ProPEAT) were applied in a Randomized Block Experimental Design at four locations. ProPEAT fertilizer (15-7-7) was analyzed to determine concentrations of all nutrients. The amount of each nutrient in the ProPEAT fertilizer was matched with the other fertilized treatments. Nitrogen was matched with urea or Polymer-Coated Urea (PCU). There was a significant fertilizer response at all four locations. Not surprisingly, application of urea resulted in rapid greening, but also excessive shoot growth early in the fall. Both the ProPEAT and PCU plots showed slow/control release properties with more steady growth throughout the fall season. In addition, the ProPEAT gave an additional improvement at the sand soil location with a significant improvement in visual appearance over all other treatments. Fertilization resulted in increases in nutrient uptake. There were no differences between fertilization treatments for all nutrients except nitrogen (N) and phosphorus (P). Urea resulted in greater shoot N concentration at two locations four weeks after application with that trend reversed late season. ProPEAT resulted in greater shoot P concentrations than all other treatments at the end of the season.
Prepared By:
Bryan G. Hopkins
Brigham Young University
Introduction
Previous research shows that blending fertilizer with humic acid can result in increased plant health and nutrient uptake, especially with P uptake. Phosphorus is poorly soluble in soil. In some cases, blending humic acid can improve P solubility. Another enhancement that can be used with fertilizer is the use of various nutrient use efficiency techniques. One approach is to use fertilizers that have controlled or slow release properties. These strategies can minimize the amount of risk for volatilization, precipitation, leaching, and gas loss. This can make nutrients more available in a steady supply.
Materials and Methods
Six replicates of four treatments (control, urea + traditional, PCU + traditional, and ProPEAT) were applied in a Randomized Block Experimental Design at four locations. ProPEAT fertilizer (15-7-7) was analyzed to determine concentrations of all nutrients. The amount of each nutrient in the ProPEAT fertilizer was matched with the other fertilized treatments. Nitrogen was applied at 2 lb per 1000 sq ft for all fertilized treatments. ProPEAT (15-7-7), urea (46-0-0), and Polymer-Coated Urea (46-0-0) were used to supply N. The amount of other nutrients was matched based on the amount applied in the ProPEAT fertilizer. The sources for the “traditional” applications used for the urea and PCU treatments was potassium phosphate, potassium sulfate, elemental S, zinc sulfate, manganese sulfate, ferrous sulfate, copper sulfate, calcium chloride, magnesium chloride, and boric acid.
Fertilizer was broadcast applied by hand to 1m x 3m plots to established turf at a loam and a sand fields in Provo, UT. Fertilizer was also applied just prior to seeding at a third location with the fertilizer raked in to a depth of 2 inches. Fertilizer was applied just prior to laying sod at a fourth location, also raked in to a depth of 2 inches. Fertilizer application occurred on August 17 and 18, 2015. All sites were planted to Kentucky bluegrass (Poa pratensis L.). The established sites had some inclusion of perennial ryegrass (Lolium perenne L.) and annual bluegrass (Poa annua L.).
Beginning on August 24, 2015, readings were taken approximately every week. Weekly readings included visual ratings on a scale of 0 to 5 with 0 being bare soil and 5 being thick, vibrant green grass, Normalized Difference Vegetative Index (NDVI), and height readings. Biomass readings were also taken on September 21 and November 16 by collecting mowing clippings at a height of 2 inches. Clippings were analyzed for most essential nutrients via combustion for N (Leco True Spec) and microwave acid digestion with analysis by ICP-OES (Thermo). Not all measurements were possible for the seeded site for approximately one month.
Results and Discussion
For turfgrass, it is desirable to have a modest but not excessive amount of growth. Rapid growth results in excessive mowing and/or scalping when mowing is done infrequently. In addition, clipping removal costs are related to the amount of biomass generated. Often, managers want to avoid clipping removal, but this can be difficult and unwise in situations where there is a high level of growth. In general, the fertilized treatments gave a significant and desirable increase in growth over the unfertilized control. For the established loam site there were no statistical differences between fertilizer treatments (Fig. 1a). For the newly seeded loam site, the PCU and urea treatments had greater growth than ProPEAT at the first sampling date on September 21st, but the trend somewhat reversed at the end of the season on November 16th (Fig. 1b). There were no differences for the newly sodded site at the first sampling, likely due to the sod having few roots for nutrient uptake at this point (Fig. 1c). However, the ProPEAT and PCU had greater growth than the urea at the last sampling date. There were no differences for the sand other than PCU having less growth at the early sample date (Fig. 1d).
Biomass readings are time consuming and difficult to take and, thus, height readings have been shown to be highly correlated to the amount of new shoot growth. These readings were taken weekly (Figs. 2a-d). Statistical analysis is not shown due to tremendous complexity, but the trends were very similar to those shown for the biomass readings.
Similarly, visual ratings (Figs. 3a-d) and NDVI readings (Figs. 4a-d) were conducted weekly. The trends for the visual ratings largely followed the height and biomass readings. The NDVI readings are an indication of plant health. Plants that are less than perfectly healthy tend to reflect less near infrared light. Although not visible to the naked eye, NDVI instruments can be used to measure this reflectance to compare it to the visible spectrum and give an assessment that is less biased and more scientific than a visual rating. Problems with plant health can be spotted 10-20 days earlier with NDVI than when visual symptoms occur.
When averaging these values for visual, NDVI and height over the course of the fall season, there were no differences for visual or height, but the urea resulted in significantly greater height than PCU or ProPEAT (Fig. 5). It should be noted that most of the visual appeal occurred very early for the urea at the expense of excessive mowing. Therefore, PCU and ProPEAT gave similar health and aesthetics without excessive mowing early on. It is particularly interesting to note the response of ProPEAT in the sand soil. The NDVI values were a little low initially, but then were numerically greater than all others from September 14th onward (Fig. 4d). PCU looked to be somewhat steady for NDVI, but urea started well, but then dropped nearly to the level of the control by the end of the season.
There were no differences for most nutrients (Table 1), with the exception of N (Figs. 6a-d) and P (Fig. 7). Not surprisingly, the general trend was for N to be high initially for the urea, but then tapering off since its N availability was all immediate and then possibly being lost (especially in the sand). The PCU and ProPEAT showed a more steady supply of N. The differences for P uptake were nearly identical across all sites and, thus, were combined for graphical purposes (Fig. 7). ProPEAT seemed to show a clear advantage over the other treatments.
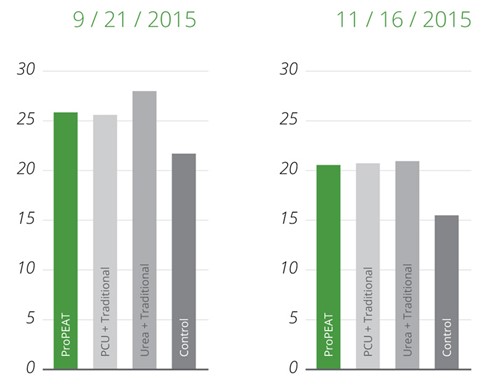
Figure 1a - Established Loam New shoot growth after 7 days, g/plot.
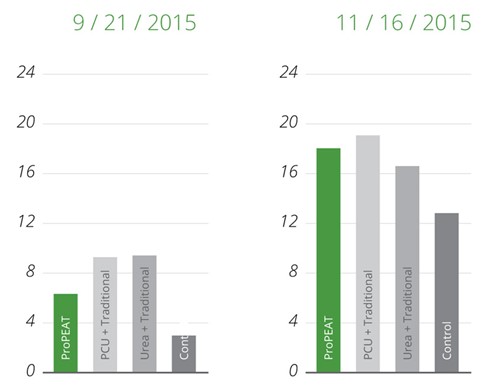
Figure 1b - Newly Seeded Loam New shoot growth after 7 days, g/plot.
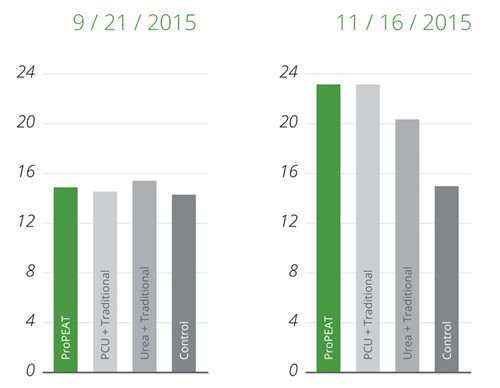
Figure 1c - Newly Sodded Loam New shoot growth after 7 days, g/plot.
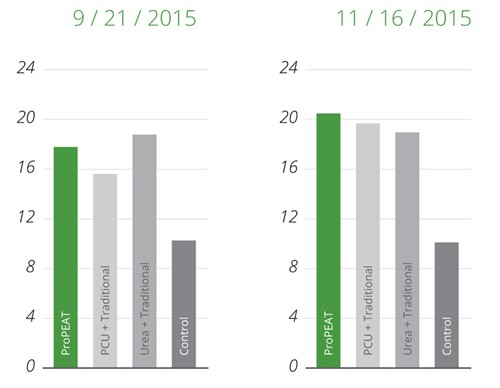
Figure 1d - Established Sand New shoot growth after 7 days, g/plot.
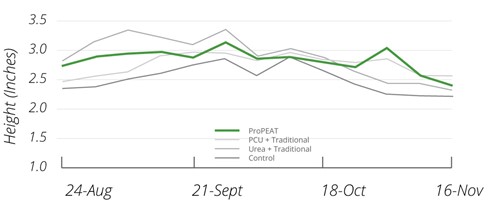
Figure 2a - Established Loam New shoot growth height.
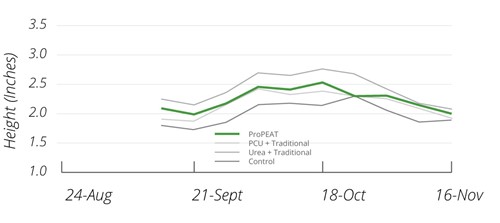
Figure 2b - Newly Seeded Loam New shoot growth height.
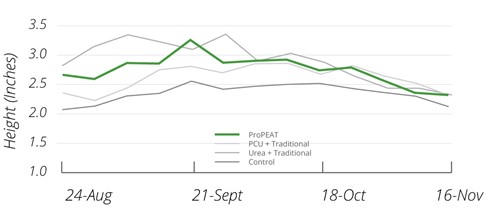
Figure 2c - Newly Sodded Loam New shoot growth height.
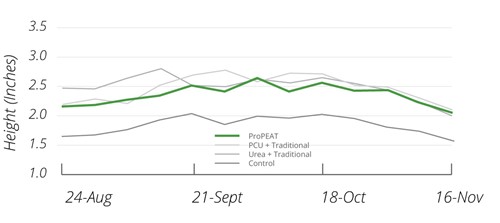
Figure 2d - Established Sand New shoot growth height.
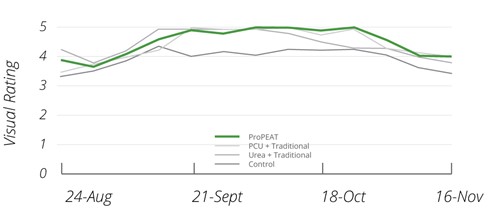
Figure 3a - Established Loam Visual Rating (0-5).
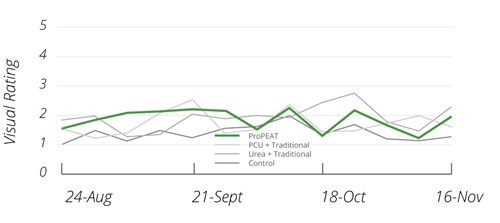
Figure 3c - Newly Sodded Loam Visual Rating (0-5).
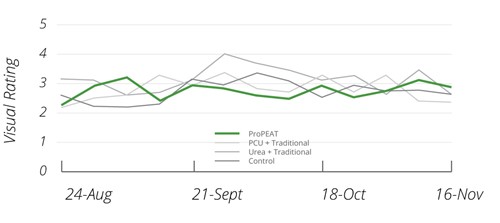
Figure 3c - Newly Sodded Loam Visual Rating (0-5).
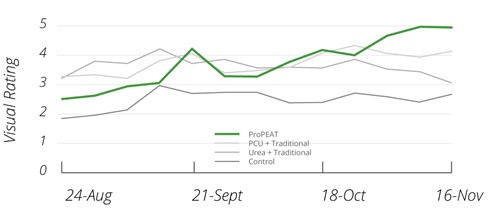
Figure 3d - Established Sand Visual Rating (0-5).
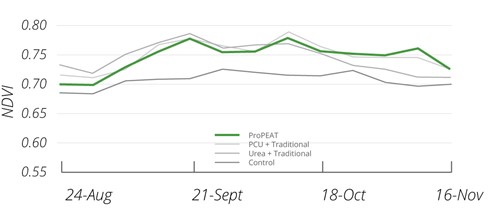
Figure 4a - Established Loam NDVI Readings.
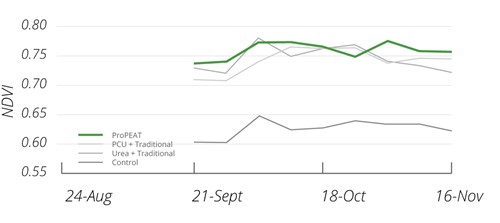
Figure 4b - Newly Seeded Loam NDVI Readings.
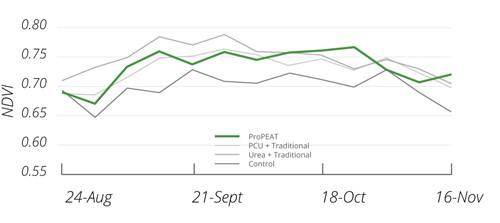
Figure 4c - Newly Sodded Loam NDVI Readings.
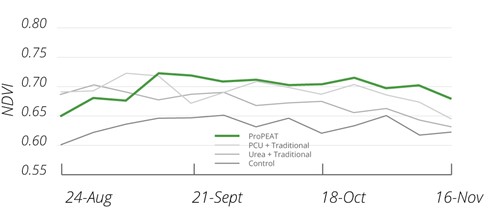
Figure 4d - Established Sand NDVI Readings.
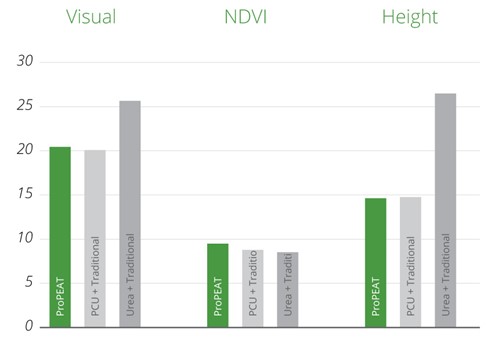
Figure 5 - Established Sand Increases relative to the Control.
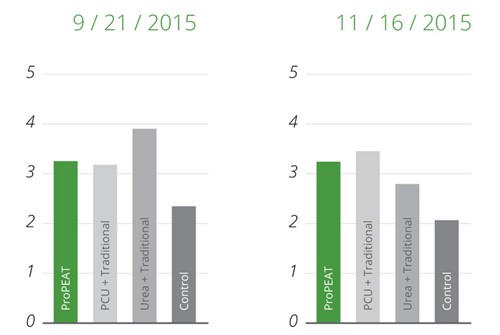
Figure 6a - Established Loam Shoot N, %
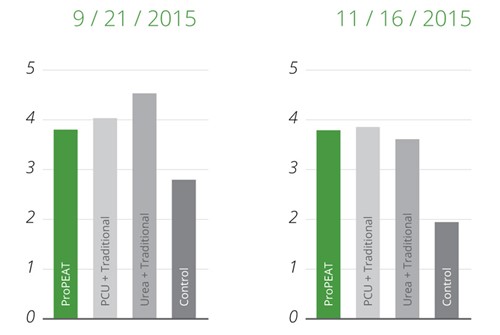
Figure 6b - Newly Seeded Loam Shoot N, %
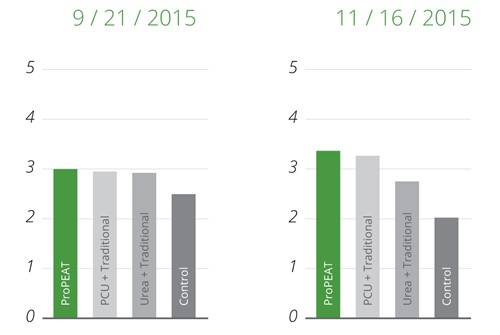
Figure 6c - Newly Sodded Loam Shoot N, %
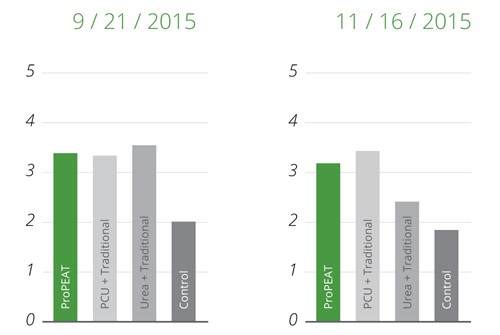
Figure 6d - Established Sand Shoot N, %
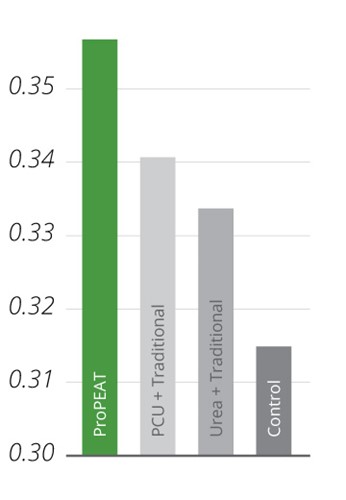
Figure 7 - Combined Across All Fields Shoot P, %